Rental yield in 45 Jacksonville-area ZIP codes, October 2026: 3-bedroom homes before and after costs
In 40 of the 45 Jacksonville-area ZIP codes CapScout covers, 3-bedroom homes listed for sale between August 23 and October 3, 2026 had a median gross yield of 7.4% against 3-bedroom asking rents in the same ZIP code. An all-listings ratio, every asking rent over every asking price, puts the same ZIP codes at 6.4%. After a printed set of operating costs, the median ZIP code's 3-bedroom has a modelled net yield of 2.5% to 3.4%. Across the 40, modelled net yields run from 1.0%–1.7% in 32034 to 3.6%–5.0% in 32209.
- 7.4%Median 3-bedroom gross yield
- 6.4%Same ZIP codes, all listings
- 2.5%–3.4%Median modelled net yield
- 40 of 45ZIP codes ranked
Key findings
- An all-listings yield runs below the bedroom-matched yield. In 34 of the 40 ZIP codes, the bedroom-matched yield is higher than the all-listings figure; the median gap across all 40 is 0.9 percentage points. The widest gap is 32082: 6.7% bedroom-matched against 4.0% all-listings. In 32208 and 32220 the two are equal to one decimal. The four exceptions are 32034, 32043, 32097 and 32216, where the bedroom-matched yield is lower, by at most 0.2 points.
- The gap comes from what is listed on each side. In the median ranked ZIP code, 3-bedrooms are a similar share of both sides (43% and 47%), but rentals lean smaller: 35% have two bedrooms or fewer, against 14% of homes for sale. A 3-bedroom rental asks a median 4% more than the ZIP's median rental; a 3-bedroom for sale asks about 6% below the ZIP's median price.
- Operating costs take 55% to 68% of gross rent at the median. Vacancy, management, repairs, insurance and property tax bring the median ranked ZIP code's 3-bedroom from 7.4% gross to 2.5% to 3.4% modelled net.
- Gross yield rises as price falls. The four ZIP codes with the lowest median 3-bedroom asks (32206, 32208, 32209 and 32254) are the four highest on the bedroom-matched measure.
- Asking rents and prices over the period. Over each ZIP code's 11-month series, ending August 2026 (13 ZIP codes), September 2026 (31 ZIP codes) or October 2026 (1 ZIP code), the median ZIP code's asking rent moved +4.1% and its median asking price 0.0%.
Which Jacksonville-area ZIP codes have the highest rental yields?
Ranked by bedroom-matched gross yield, among ZIP codes with at least 20 three-bedroom homes for sale and 10 for rent. The other 5 are in the full table with their counts.
| ZIP | 3-bed median ask | 3-bed median rent | Bedroom-matched yield | All-listings yield | Modelled net (3-bed) |
|---|---|---|---|---|---|
| 32209 | $129,900 | $1,250 | 11.5% | 10.4% | 3.6%–5.0% |
| 32254 | $165,000 | $1,300 | 9.5% | 9.1% | 2.7%–3.9% |
| 32208 | $175,000 | $1,345 | 9.2% | 9.2% | 2.7%–3.9% |
| 32206 | $179,900 | $1,348 | 9.0% | 7.8% | 2.6%–3.8% |
| 32221 | $259,900 | $1,895 | 8.7% | 7.7% | 3.1%–4.1% |
| 32244 | $255,000 | $1,790 | 8.4% | 7.7% | 2.8%–3.8% |
| 32220 | $250,000 | $1,749 | 8.4% | 8.4% | 2.8%–3.8% |
| 32210 | $230,990 | $1,615 | 8.4% | 7.7% | 2.7%–3.7% |
| 32222 | $294,500 | $2,000 | 8.1% | 7.7% | 2.9%–3.8% |
| 32211 | $250,000 | $1,695 | 8.1% | 7.4% | 2.6%–3.6% |
The for-sale side includes homes listed as-is, while a home listed for rent is generally ready to occupy, so a bedroom-matched yield can overstate what a rental-ready purchase earns.
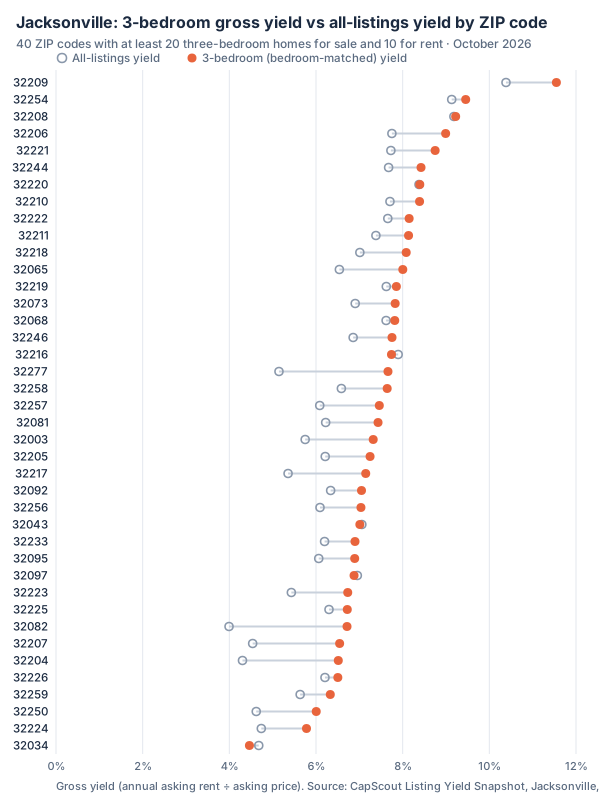
Why the two yields differ
An all-listings yield divides the median asking rent of everything for rent by the median asking price of everything for sale. In these ZIP codes the two sides hold different homes. Rental listings lean toward smaller units: in the median ranked ZIP code, 35% of rentals have two bedrooms or fewer, against 14% of homes for sale. So the median rental is a smaller home than the median home for sale, and the all-listings ratio sets a small home's rent against a larger home's price. Matching bedrooms removes most of that, though not all: 3-bedrooms for sale are a median 6% larger than 3-bedrooms for rent.
The all-listings median price also includes land (925 of 14,699 listings), which pulls it down, and multi-family buildings priced whole (212), which pull it up.
What does a 3-bedroom earn after costs?
The modelled net yields take out:
- vacancy: 6% of gross rent
- property management: 10% of collected rent
- repairs and capital reserve: 12% of gross rent
- landlord insurance: $3,000 to $4,000 a year, a CapScout assumption for a Florida landlord policy on a typical home; premiums depend on the home's age, roof, construction, wind and flood zone and rebuild cost, so a flat figure understates insurance on higher-value and coastal homes
- property tax: 1.1% to 1.7% of the asking price a year, one band for every ZIP code
The low end of each range uses the higher costs.
The share of gross rent the model takes runs from 55% in 32081, 56% in 32082 and 59% in 32221 at the low end to 70% in 32034 and 65% in 32207 at the high end. That spread comes from the method rather than from what owning in each ZIP code costs: vacancy, management and repairs are the same share of rent everywhere, insurance is a fixed dollar amount and tax a share of price, so what is left depends on each ZIP code's price and rent. Costs it leaves out everywhere include turnover gaps longer than the vacancy allowance, nonpayment, capital repairs beyond the reserve, HOA dues, CDD assessments and flood insurance. Because these costs are left out, actual net yields would tend to run below the modelled ranges.
Property tax assumptions
Florida taxes a rental on its full taxable value: an investor gets neither the homestead exemption nor the Save Our Homes cap. Duval County's 2025 rate is 17.74 mills in most of Jacksonville and up to 18.45 in Jacksonville Beach and 18.97 in Baldwin; the other counties' rates are lower. Applied to a taxable value somewhat below the purchase price, that is roughly 1.1% to 1.7% of the price a year. A seller's bill under homestead and Save Our Homes can be far below a buyer's, because the assessment resets to just value on January 1 after the sale.
Newer subdivisions in several of these counties carry CDD assessments on the tax bill on top of property tax and HOA, and none is in the model.
On a house at about $331,000, the median 3-bedroom ask among ranked ZIP codes, the two ends of the tax band differ by about $1,980 a year, 0.6 points of yield.
How long are homes for sale listed?
| Area (ZIP codes) | Homes for sale, median days listed |
|---|---|
| Jacksonville (45) | 49 |
Days listed counts, for each listing active during the month, the days from listing to removal, or to the data date if it is still up; the figure is the median across those listings, rounded to whole days. It measures how long homes sit on the market, not the sale-to-list gap. Rental listing times are not published here.
What changed over the 11 months to each data date
| Area | Asking rent | Asking price | Homes listed for sale |
|---|---|---|---|
| Jacksonville | +4.1% | 0.0% | −16.1% |
Each figure compares the first and last month of a ZIP code's monthly series, an 11-month span; because ZIP codes were refreshed on different dates, their series end between August 2026 and October 2026. The last month counts only listings active up to the data date, which understates the last column. A change in which homes happen to be listed can move a median as much as a change in what they are worth. Rent changes use ZIP codes with at least 10 rental listings.
All 45 ZIP codes
Show the full table
| ZIP | For sale | For rent | Median ask | Median rent | All-listings yield | 3-bed ask | 3-bed rent | 3-bed yield | 3-bed for sale / for rent | Modelled netranked ZIP codes | Days listed, sale | Rent change | Price change |
|---|---|---|---|---|---|---|---|---|---|---|---|---|---|
| 32209 | 460 | 379 | $127,000 | $1,099 | 10.4% | $129,900 | $1,250 | 11.5% | 235 / 165 | 3.6%–5.0% | 66 | +4.7% | −5.6% |
| 32254 | 163 | 122 | $164,000 | $1,248 | 9.1% | $165,000 | $1,300 | 9.5% | 92 / 55 | 2.7%–3.9% | 40 | +4.1% | +0.6% |
| 32208 | 314 | 175 | $169,900 | $1,300 | 9.2% | $175,000 | $1,345 | 9.2% | 175 / 108 | 2.7%–3.9% | 56 | 0.0% | +3.0% |
| 32206 | 221 | 196 | $185,000 | $1,195 | 7.8% | $179,900 | $1,348 | 9.0% | 98 / 65 | 2.6%–3.8% | 73 | −0.3% | 0.0% |
| 32221 | 215 | 142 | $309,000 | $1,990 | 7.7% | $259,900 | $1,895 | 8.7% | 105 / 75 | 3.1%–4.1% | 49 | +9.8% | +6.6% |
| 32244 | 438 | 397 | $265,000 | $1,695 | 7.7% | $255,000 | $1,790 | 8.4% | 272 / 196 | 2.8%–3.8% | 46 | +2.8% | +6.0% |
| 32220 | 108 | 45 | $265,000 | $1,850 | 8.4% | $250,000 | $1,749 | 8.4% | 46 / 23 | 2.8%–3.8% | 59 | +7.6% | +2.0% |
| 32210 | 474 | 406 | $225,000 | $1,445 | 7.7% | $230,990 | $1,615 | 8.4% | 242 / 175 | 2.7%–3.7% | 47 | +3.6% | 0.0% |
| 32222 | 130 | 109 | $317,990 | $2,029 | 7.7% | $294,500 | $2,000 | 8.1% | 67 / 76 | 2.9%–3.8% | 61 | +6.0% | −5.1% |
| 32211 | 174 | 195 | $250,000 | $1,538 | 7.4% | $250,000 | $1,695 | 8.1% | 105 / 80 | 2.6%–3.6% | 46 | +16.1% | −5.6% |
| 32218 | 743 | 443 | $324,990 | $1,899 | 7.0% | $270,990 | $1,825 | 8.1% | 359 / 219 | 2.7%–3.7% | 30 | +4.6% | +3.2% |
| 32065 | 248 | 216 | $345,000 | $1,880 | 6.5% | $269,900 | $1,800 | 8.0% | 84 / 109 | 2.6%–3.6% | 49 | +1.6% | −2.8% |
| 32219 | 443 | 95 | $306,850 | $1,949 | 7.6% | $275,000 | $1,800 | 7.9% | 164 / 50 | 2.5%–3.5% | 25 | +3.9% | −1.3% |
| 32234 | 223 | 10 | $312,400 | $1,829 | 7.0% | $279,900 | $1,829 | 7.8% | 86 / 6 | — | 14 | −3.7% | −0.2% |
| 32073 | 257 | 170 | $325,000 | $1,870 | 6.9% | $289,000 | $1,885 | 7.8% | 139 / 83 | 2.6%–3.5% | 39 | +4.5% | −1.5% |
| 32068 | 661 | 209 | $314,900 | $1,999 | 7.6% | $283,990 | $1,850 | 7.8% | 300 / 117 | 2.6%–3.5% | 44 | +7.2% | −4.6% |
| 32246 | 303 | 202 | $315,000 | $1,800 | 6.9% | $325,000 | $2,100 | 7.8% | 141 / 102 | 2.7%–3.6% | 46 | 0.0% | −6.5% |
| 32216 | 273 | 203 | $250,000 | $1,645 | 7.9% | $279,000 | $1,800 | 7.7% | 131 / 87 | 2.5%–3.4% | 62 | +2.8% | −1.0% |
| 32202 | 29 | 34 | $245,000 | $1,725 | 8.4% | $495,000 | $3,190 | 7.7% | 5 / 5 | — | 96 | +50.0% | +23.2% |
| 32277 | 158 | 182 | $309,000 | $1,325 | 5.1% | $289,000 | $1,845 | 7.7% | 81 / 63 | 2.5%–3.4% | 41 | −19.3% | +1.3% |
| 32258 | 190 | 127 | $369,000 | $2,025 | 6.6% | $345,432 | $2,200 | 7.6% | 88 / 59 | 2.7%–3.6% | 52 | +1.3% | −1.6% |
| 32257 | 233 | 128 | $354,900 | $1,800 | 6.1% | $345,000 | $2,145 | 7.5% | 110 / 63 | 2.6%–3.4% | 41 | −5.0% | +4.7% |
| 32081 | 441 | 85 | $674,900 | $3,500 | 6.2% | $549,000 | $3,400 | 7.4% | 118 / 29 | 3.0%–3.7% | 47 | +16.7% | +0.7% |
| 32003 | 185 | 88 | $480,000 | $2,300 | 5.8% | $345,900 | $2,110 | 7.3% | 55 / 37 | 2.5%–3.3% | 43 | +6.5% | +6.7% |
| 32205 | 324 | 323 | $284,900 | $1,475 | 6.2% | $277,000 | $1,673 | 7.2% | 179 / 93 | 2.1%–3.1% | 61 | +7.3% | −3.4% |
| 32217 | 151 | 88 | $335,000 | $1,495 | 5.4% | $331,589 | $1,975 | 7.1% | 75 / 32 | 2.3%–3.2% | 54 | −0.3% | +7.5% |
| 32092 | 1,023 | 268 | $488,485 | $2,580 | 6.3% | $400,000 | $2,350 | 7.0% | 364 / 106 | 2.4%–3.3% | 38 | +8.6% | −0.3% |
| 32256 | 514 | 339 | $325,000 | $1,650 | 6.1% | $332,517 | $1,950 | 7.0% | 212 / 117 | 2.2%–3.1% | 38 | 0.0% | −1.2% |
| 32043 | 710 | 137 | $362,990 | $2,135 | 7.1% | $338,850 | $1,980 | 7.0% | 239 / 46 | 2.2%–3.1% | 34 | +10.3% | +2.6% |
| 32233 | 155 | 104 | $425,000 | $2,195 | 6.2% | $400,000 | $2,300 | 6.9% | 68 / 44 | 2.3%–3.2% | 53 | +31.0% | −22.7% |
| 32095 | 394 | 122 | $475,000 | $2,400 | 6.1% | $383,000 | $2,200 | 6.9% | 137 / 60 | 2.3%–3.1% | 47 | +4.6% | −1.0% |
| 32097 | 448 | 136 | $399,500 | $2,315 | 7.0% | $369,000 | $2,115 | 6.9% | 171 / 59 | 2.2%–3.1% | 49 | +4.8% | −6.7% |
| 32223 | 157 | 51 | $485,000 | $2,195 | 5.4% | $385,900 | $2,165 | 6.7% | 68 / 32 | 2.2%–3.0% | 53 | +3.1% | +6.4% |
| 32225 | 279 | 195 | $399,999 | $2,100 | 6.3% | $374,900 | $2,100 | 6.7% | 145 / 119 | 2.1%–3.0% | 44 | +6.5% | −4.7% |
| 32082 | 395 | 134 | $900,082 | $2,995 | 4.0% | $679,000 | $3,800 | 6.7% | 100 / 53 | 2.6%–3.3% | 70 | −3.4% | −9.5% |
| 32207 | 278 | 259 | $330,000 | $1,248 | 4.5% | $330,000 | $1,800 | 6.5% | 123 / 52 | 1.8%–2.7% | 47 | −4.0% | +1.5% |
| 32011 | 103 | 17 | $350,000 | $2,000 | 6.9% | $350,000 | $1,900 | 6.5% | 41 / 9 | — | 57 | 0.0% | +9.4% |
| 32204 | 87 | 123 | $389,000 | $1,395 | 4.3% | $350,000 | $1,900 | 6.5% | 33 / 23 | 1.9%–2.8% | 74 | +11.6% | −2.8% |
| 32226 | 224 | 112 | $435,000 | $2,250 | 6.2% | $393,000 | $2,130 | 6.5% | 68 / 47 | 2.0%–2.9% | 79 | +7.1% | +1.2% |
| 32259 | 694 | 194 | $574,000 | $2,695 | 5.6% | $455,000 | $2,400 | 6.3% | 232 / 65 | 2.0%–2.8% | 48 | +5.7% | +2.7% |
| 32250 | 339 | 163 | $699,900 | $2,695 | 4.6% | $699,000 | $3,498 | 6.0% | 142 / 53 | 2.1%–2.8% | 73 | −5.3% | 0.0% |
| 32224 | 288 | 131 | $480,000 | $1,895 | 4.7% | $465,000 | $2,240 | 5.8% | 113 / 55 | 1.6%–2.5% | 50 | −6.7% | −12.4% |
| 32046 | 121 | 7 | $330,900 | $1,500 | 5.4% | $345,900 | $1,500 | 5.2% | 47 / 6 | — | 67 | — | +8.8% |
| 32034 | 902 | 122 | $639,900 | $2,495 | 4.7% | $699,000 | $2,600 | 4.5% | 353 / 47 | 1.0%–1.7% | 76 | −5.7% | −5.2% |
| 32009 | 29 | 2 | $449,000 | — | — | — | — | — | 3 / 1 | — | 99 | — | +10.3% |
Download: CSV · JSON · chart (SVG)
Limitations
- Coverage. 45 ZIP codes across Duval, Clay, Nassau and St. Johns counties that CapScout holds data for, not every ZIP code in the metro. Area figures describe these ZIP codes only.
- Small samples withheld. A median over fewer than 5 listings is not shown; those cells read "—" in the table and are blank in the downloads.
- Asking, not closing. Asking prices of homes listed for sale and asking rents of homes listed for rent. No closed sales, no signed leases.
- Aggregates only. Every figure is a ZIP-level median. No listing, address or individual price appears here.
- Not investment advice.
Methodology
Data: 14,699 homes listed for sale (including 212 multi-family and 925 land listings) and 7,385 listed for rent across 45 ZIP codes, as published by listing feeds and dated August 23 to October 3, 2026. Each ZIP code's figures are medians of the listings in it; area figures are unweighted medians of ZIP figures.
Bedroom-matched yield: the median asking rent of 3-bedroom rental listings × 12, divided by the median asking price of 3-bedroom homes for sale in the same ZIP code. Both sides include every property type. Ranked where there were at least 20 three-bedroom homes for sale and 10 for rent: 40 of the 45 ZIP codes, covering 6,029 three-bedroom homes for sale and 3,139 for rent.
All-listings yield: the median asking rent of every rental listing × 12, divided by the median asking price of every home for sale. Gross yields deduct nothing.
Modelled net yield: the cost assumptions above, applied to each ZIP code's 3-bedroom median rent and price.
Changes: first versus last month of each ZIP code's monthly median series (an 11-month series ending August 2026 to October 2026).
Cite as: CapScout Listing Yield Snapshot, Jacksonville, October 2026 edition. capscout.ai/markets/jacksonville-fl
Licence: the figures, tables, chart and downloads on this page are published under CC BY 4.0. Reuse them with attribution to the CapScout Listing Yield Snapshot and a link to this page.
Press: the CapScout research team, [email protected]
Frequently asked questions
What is the average rental yield in these Jacksonville-area ZIP codes?
Across the 40 Jacksonville-area ZIP codes with enough 3-bedroom listings, the median ZIP code's 3-bedroom listings, dated August 23 to October 3, 2026, carried a 7.4% gross yield against 3-bedroom asking rents in the same ZIP code, and an all-listings ratio puts the same ZIP codes at 6.4%. Gross yield deducts nothing; the modelled net yield at the median is 2.5% to 3.4%.
Is gross yield the same as cap rate?
No. Gross yield is annual rent divided by price with nothing taken out. A cap rate divides net operating income (rent after vacancy, management, repairs, insurance and property tax) by value. On this report's cost assumptions, the median ranked ZIP code goes from 7.4% gross to 2.5% to 3.4% net.
Do any of these Jacksonville-area ZIP codes meet the 1% rule?
No. On 3-bedroom asking figures the median ranked ZIP code is 0.62% of price a month and the highest is 0.96%.
How current is this data, and where does it come from?
Asking prices of homes listed for sale and asking rents of homes listed for rent, dated August 23 to October 3, 2026: 14,699 for-sale and 7,385 rental listings across 45 ZIP codes. No closed sales and no signed leases.
About CapScout. An AI acquisition platform for investors and the firms that help them buy residential investment property on the open market. This report ranks ZIP codes; the product ranks the listings inside them against the return you set.
Search a marketHow it works